No, Global Warming Hasn’t Stopped
By Collin Maessen on commentVentures Into Scepticism
Real Sceptic has its origins as a companion site for the videos produced by Collin Maessen. The site has progressed beyond this original purpose and now predominantly includes articles that are independent of the content released on YouTube. However this original content is still an important part of the site.
This page serves as an archive for videos produced and released on YouTube. You can find full transcripts, source listing and used media files for the videos. We are currently in the process of transcribing all the audio.
Please note that the first nine videos are of a substantial lower quality than videos that were produced after these. As these first nine videos were as much, and in some case more, about learning to edit videos and learning how to tell a story in sound and images.
Video description
The claim that global warming has stopped is popping up more and more in the media. Most of it comes from the usual suspects like cfact who push this narrative in an attempt to discredit the science behind global warming. Unfortunately this ignores how temperatures respond on a warming world and ignores a vast array of evidence that shows that it hasn't stopped.
Transcript
The claim that global warming has stopped is popping up more and more in the media. Most of it comes from the usual suspects like cfact, who push this narrative in an attempt to discredit the science behind global warming. The billboard they showed is an example of them trying to do this.
But unfortunately a slowing down of the increase in temperatures, even if it has lasted for 16 years, cannot be used for that. It is simply based on a misunderstanding of the science involved. The perfect example of this is the Daily Mail article that made the same argument.
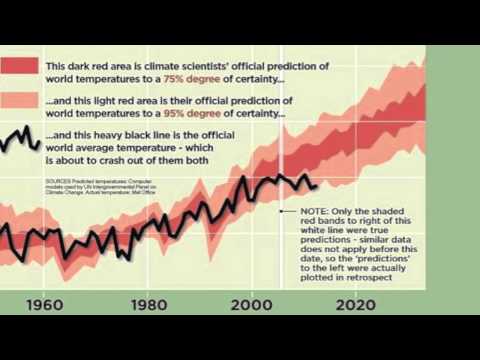
Lets start with the note they attached to this graph:
Only the shaded red bands to right of this white line were true predictions – similar data does not apply before this date, so the 'predictions' to the left were actually plotted in retrospect.
It's correct that this wasn't a prediction, it's what scientists call a hindcast, but it doesn't mean what is being implied.
A hindcast is a model run where they put in the real values of what for example CO2, other greenhouse gasses, volcanoes, and the sun have done. They then run the models with this information to see if they can replicate the measured temperatures. And the graph shows they did, it's a way to check if a model represents the world accurately enough so it can be used for projections.
If they didn't match what we had measured it would mean there was something horribly wrong with the models. What was being pointed out is actually not something that casts doubt on our ability to project temperature increases, it actually shows the models can do it.
Now lets focus on the 'failed prediction' claim; this is where the biggest misconception is. I'll let Ben Santer, one of the IPCC authors, explain how those projections are made:
[The General Public: Why Such Resistance? - 0:24:27 / 0:27:10]
This is from a climate model, a Japanese climate model, uhm, these are from experiments that were performed in support of the IPCC fourth assessment report in 2007.
What you see here are tropospheric temperature time series. And you can see that there is this black line here, this small overall warming trend. This is an experiment, or a model, that is driven by changes in greenhouse gases, changes in the sun's energy output, changes in aerosols in ozone. We call them also colloquially everything in the kitchen sink experiments, where you try and drive a climate model with your best estimate of the actual.. uh... factors that have been important over the twentieth century.
And you can calculate from this climate model something akin to the satellite temperatures that i've shown you. And in this particular run of this Japanese model you have a la-nina, that's that blue thing, near the end which tends to cool it down. And you have an el-nino near the beginning, that's the red thing, which tends to warm things up. Because this is a short record uh... only a little over twenty years, and you have a warm blip near the beginning and a cool blip near the end you don't get much overall change.
[...]
But in the climate model world you can essentially rerun the twentieth century many times and get many different sequences of these things. And what you do then at the end is you average over all of these things, you average over these five realisations, and that beats down the noise. Because the noise is not correlated from one realisation to the next so you get a better estimate of the thing you're really interested in which is the slow overall increase in temperature. In this case in response to human caused changes in greenhouse gases and and all that other nice stuff.
Did you catch the very important detail? Let me repeat it:
Because this is a short record uh... only a little over twenty years, and you have a warm blip near the beginning and a cool blip near the end you don't get much overall change.
The models can replicate the current scenario that we're experiencing. We expect these periods to happen as this isn't a new phenomenon to climate science. It's the reason why scientists aren't that surprised by what is currently happening.
In projections we don't see such periods as these are filtered out by doing multiple runs of the model. Which then leaves you with the underlying warming signal of our CO2 emissions. That's why what we measure can deviate from the projections, it's not even strange if what we measure would go outside of the 95% range. Something we see happen in the hindcast.
And if you look at the graph of global temperatures you'll notice that we had a warm blip in 1998, caused by an el-nino event. It marked the end of a period where we had a lot of strong el-nino events, which tend to increase temperatures. Now this pattern has shifted to weaker el-nino events, and more la-nina events, which tends to cause cooler temperatures.
This is one of the reasons that makes it look like the planet has stopped warming; but this doesn't mean the world isn't. The planet is still gaining heat at a rate of 4 Hiroshima sized atom bombs each second. So the next question is, where is all this heat going?
As they say the devil is in the details, and the details in this case are very important. One of them being is that plateaus, where temperatures barely did anything, have happened before. And each time it was shown that these relatively short periods can't be used to determine what will happen in the long run. As temperatures just continued to rise after these relatively short periods.
The other detail, which is the important one, is that of all the heat our planet is absorbing only about 2% goes into warming our atmosphere, where we measure our temperatures. The vast majority, over 90% of it, goes into warming the oceans. So a small shift in where this heat is going will affect our temperature measurements greatly. It's the very reason why el-nino and la-nina events can have such a big effect.
Scientists have been looking if such a shift is indeed the cause of the slow down in the surface temperatures. What they found is that the oceans, especially the deep oceans, have been accumulating a lot more heat the past decade. The reason for this is that the oceans at the moment are more efficiently absorbing the extra heat our planet is retaining. And if the heat is absorbed by the oceans then it can't cause an increase in temperatures.
Another detail is that if you remove what Ben Santer referred to as climate noise, which are for example el-nino events, from the temperature record a very clear picture arises: that temperatures are still increasing. They are just being masked by natural variability of our planet.
This is why the claim that global warming has stopped based on our temperature record is very deceptive. It can be a honest mistake to make, as in the mind of many global warming is synonymous to increases in temperature. But it cannot be used to claim that global warming has stopped as many of the so-called sceptics have done. As that is just based on an oversimplification of what happens in a warming world.
Sources
- cfact - UN climate delegates unaware global warming stopped 16 years ago
- The Great Green Con no. 1: The hard proof that finally shows global warming forecasts that are costing you billions were WRONG all along
- Climate Change 2001: Working Group I: The Scientific Basis – figure 4
- Climate Change 2001: Working Group I: The Scientific Basis - 8.5.5 Past Climates
- The General Public: Why Such Resistance?
- Multivariate ENSO Index (MEI)
- 4 Hiroshima bombs worth of heat per second
- Climate Change 2007: Working Group I: The Physical Science Basis - 5.2.2.3 Implications for Earth’s Heat Balance
- An observationally based energy balance for the Earth since 1950
- Distinctive climate signals in reanalysis of global ocean heat content
- Retrospective prediction of the global warming slowdown in the past decade
- World ocean heat content and thermosteric sea level change (0-2000), 1955-2010
- Externally forced and internally generated decadal climate variability associated with the Interdecadal Pacific Oscillation
- Global temperature evolution 1979–2010
Media resources
- cfact - UN climate delegates unaware global warming stopped 16 years ago
- The General Public: Why Such Resistance?
- NASA – Supercomputing the climate
- Climate Change 2007: Working Group I: The Physical Science Basis – figure SPM.5
- Multivariate ENSO Index (MEI)
- Global Mean Temperature
- Where is global warming going?
- Average of 5 adjusted data sets (explanation)
0 reader comments
Constructive and on-topic comments that move the discussion forward are always welcome, no matter what line of argumentation they take. Comments that add nothing interesting or which try to derail discussions won't be allowed. The rules for commenting are defined in our Community and Discussion Guidelines and Site Terms and Conditions of Use.