The 2007 IPCC Report Uses A Statistical Fraudulent Technique
By Collin Maessen on commentClimate Changes, But Facts Don’t: Debunking Monckton
On the 19th of July in 2011 the National Press Club of Australia held a debate on climate change. In this video I will be analysing the claims Monckton made during the debate and if they are correct or not.
The reason I’m doing this is that Monckton challenges his critics to check his sources, or like he put it in this debate “to do your homework”. I’m going to follow him up on this to see if the scientific literature, and other available sources, corroborate what he’s saying.
Video description
On the 19th of July in 2011 the National Press Club of Australia held a debate on climate change. I will be analysing the claims Monckton made during the debate and if they are correct or not.
In this particular section of the debate Monckton makes the following claim:
"Or I wonder why the published version of the 2007 UN report deploys a flagrantly fraudulent statistical technique to pretend that the world is warming ever faster and that we are to blame. "
In this video I will explain to which chart Monckton is referring, what this "flagrantly fraudulent statistical technique" is and what the report actually states.
Transcript
Or I wonder why the published version of the 2007 UN report deploys a flagrantly fraudulent statistical technique to pretend that the world is warming ever faster and that we are to blame.
Now this was also a claim that I wasn't familiar with, so I followed up with Monckton to clarify what his point was.
This is what he said:
The fraudulent technique to which I referred during the debate was the superimposition of four distinct trend-lines on a thrice-repeated graph of the Hadley Center/CRU global temperature dataset, and the false attempt by the IPCC, in at least three places in its Fourth Assessment Report, to draw the unjustifiable conclusion from the ratios of the slopes of the four trend-lines that the Earth is warming ever faster and that we are to blame.
With this bit of information I could trace down what his argument is. I'll let Monckton give the detailed explanation:
[Updated with Slides - Lord Christopher Monckton Speaking in St. Paul – 0:43:40 till 0:44:50]
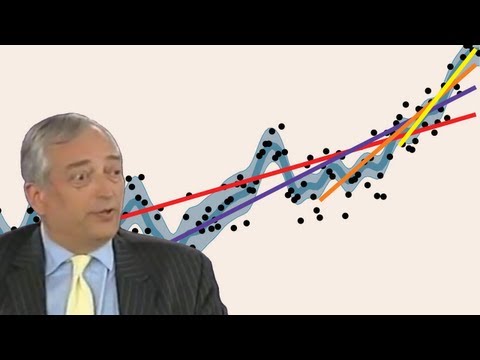
Here is the latest lie in the 2007 report. The iconic lie there. They're attempting to show that global warming is accelerating, implication that our CO2 emissions are accelerating and this is causing a more rapid rate of warming.
This is a statistical lie known as the start point or endpoint fallacy. Where you take a jiggly up and downy dataset like temperature, where you don't know which way it's going to go next, a stochastic dataset. If you choose your start point and your endpoints carefully enough you can make it look as though any trend you want is happening. Here they've tried to show a rising trend.
I'm now going to take the same dataset, but i'm going to take the more recent end of it, between 1993 and the present, and i'm going to choose my own start points. Look at this.
Top left, 1993 to the present. Top right , 2000... 1997 to the present. Bottom left, 2001 to the present. Bottom right, two thousand and five to the present. We're heading for a new ice age!
And he's right with that, if you pick your own start and/or end points you can most of the time show any trend you want. Especially if you take very short time spans like Monckton did with his examples, the climate is very variable in the short term and that makes it hard to pick up any underlying trends. It's the reason why climate trends are calculated over relative long time periods of for example 20 years.
That these trends can be misleading is exactly what the IPCC says in the very chapter they show this chart the first time:
[http://www.ipcc.ch/pdf/assessment-report/ar4/wg1/ar4-wg1-chapter3.pdf Page 336]
Another low-pass filter, widely used and easily understood, is to fit a linear trend to the time series although there is generally no physical reason why trends should be linear, especially over long periods. The overall change in the time series is often inferred from the linear trend over the given time period, but can be quite misleading. Such measures are typically not stable and are sensitive to beginning and end points, so that adding or subtracting a few points can result in marked differences in the estimated trend.
One of the reasons they say this is for example mentioned in chapter 3 “Observations: Surface and Atmospheric Climate Change” where this graph first appears, it says on page 246:
...only in the last decade is an overall warming signal clearly emerging. Therefore, the recent strong warming appears to be related in part to the AMO [Atlantic Multidecadal Oscillation] in addition to a global warming signal.
What they are referring to with this is that earlier in the century the human signal wasn't even detectable. In the report itself they say our contribution to the increasing temperatures could only be detected since 1970. And now it is somewhat enhanced by natural cycles. This is what makes these linear trend lines not ideal for taking a look at what our climate is doing.
This is exactly the reason why they are not basing any future predictions, claims or concluding how much we have contributed to increasing temperatures on these linear trends. The actual attribution of this warming happens in for example Chapter 9 which is called “Understanding and Attributing Climate Change”. Which uses far more research and sophisticated methods than linear trend-lines.
So this graph is not used, like monckton claims, to “pretend that the world is warming ever faster and that we are to blame”.
But there's another part that needs addressing, the claim that this is somehow fraudulent. This was also a point I contacted Monckton for to get further clarification on. And there's a huge problem with his explanation.
In his answer to me he explains that basing their conclusions and projections on linear trends while being pointed out to them that this is incorrect and not correcting the mistake is fraudulent.
But the thing is, as I've just explained, they are not basing projections and conclusions on these linear trend lines. And as such it cannot be in any way fraudulent.
Sources
- Updated with Slides - Lord Christopher Monckton Speaking in St. Paul
- IPCC - Chapter 3 Observations: Surface and Atmospheric Climate Change
- IPCC - Climate Change 2007: The Physical Science Basis
0 reader comments
Constructive and on-topic comments that move the discussion forward are always welcome, no matter what line of argumentation they take. Comments that add nothing interesting or which try to derail discussions won't be allowed. The rules for commenting are defined in our Community and Discussion Guidelines and Site Terms and Conditions of Use.